When you evaluate a potential business, are you just looking at the profit margin?
You could be leaving a far more lucrative business if that’s the main consideration.
You also need to consider the customer re-order rate/ inventory turnover (number of times you replenish the inventory in a year).
A business with a far lower profit margin can be far more profitable than one with a higher profit margin simply due to the inventory turnover.
For example:
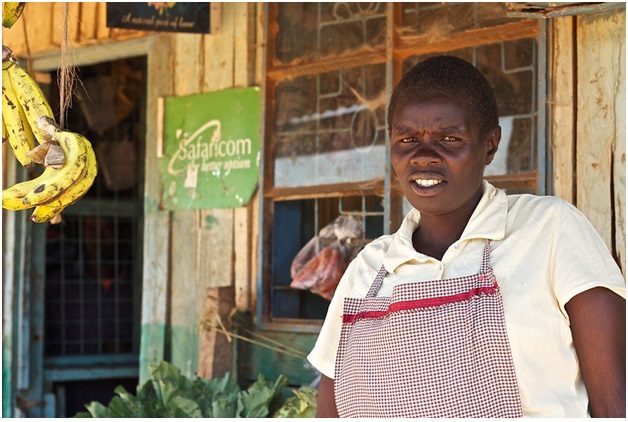
A business with a start-up capital of merely KSh 10,000 and a 35% net profit margin, that consistently replenishes its stock every month, will end up having a net worth of KSh 309,086,076 after only 2 years, if all profit is reinvested (not considering scalability).
On the other hand, a business with a start-up capital of KSh 1,000,000 and a net profit margin of 90% (about three times the net profit margin of the “small biashara”), but only replenishes its stock every year, will end up having a net worth of KSh 100,000,000 after 2 years, if all profit is reinvested (not considering scalability).
That means the “small biashara” ends up being worth KSh 209,086,076 more than the million-shilling company, after two years (not considering scalability).
Here is a table showing the growth of the “small biashara”:
| Number of Days After Start of Business | Capital at Beginning of Stock Period | Profit | Profit Re-Invested in Business | Capital at End of Stock Period |
| 30 | 10,000 | 5384.615385 | 5384.615385 | 15,385 |
| 60 | 15,385 | 8284.023669 | 8284.023669 | 23,669 |
| 90 | 23,669 | 12744.6518 | 12744.6518 | 36,413 |
| 120 | 36,413 | 19607.15661 | 19607.15661 | 56,020 |
| 150 | 56,020 | 30164.85633 | 30164.85633 | 86,185 |
| 180 | 86,185 | 46407.47127 | 46407.47127 | 132,593 |
| 210 | 132,593 | 71396.10965 | 71396.10965 | 203,989 |
| 240 | 203,989 | 109840.1687 | 109840.1687 | 313,829 |
| 270 | 313,829 | 168984.8749 | 168984.8749 | 482,814 |
| 300 | 482,814 | 259976.7306 | 259976.7306 | 742,791 |
| 330 | 742,791 | 399964.201 | 399964.201 | 1,142,755 |
| 360 | 1,142,755 | 615329.5399 | 615329.5399 | 1,758,084 |
| 390 | 1,758,084 | 946660.8307 | 946660.8307 | 2,704,745 |
| 420 | 2,704,745 | 1456401.278 | 1456401.278 | 4,161,147 |
| 450 | 4,161,147 | 2240617.351 | 2240617.351 | 6,401,764 |
| 480 | 6,401,764 | 3447103.617 | 3447103.617 | 9,848,867 |
| 510 | 9,848,867 | 5303236.333 | 5303236.333 | 15,152,104 |
| 540 | 15,152,104 | 8158825.128 | 8158825.128 | 23,310,929 |
| 570 | 23,310,929 | 12552038.66 | 12552038.66 | 35,862,968 |
| 600 | 35,862,968 | 19310828.7 | 19310828.7 | 55,173,796 |
| 630 | 55,173,796 | 29708967.24 | 29708967.24 | 84,882,764 |
| 660 | 84,882,764 | 45706103.44 | 45706103.44 | 130,588,867 |
| 690 | 130,588,867 | 70317082.22 | 70317082.22 | 200,905,949 |
| 720 | 200,905,949 | 108180126.5 | 108180126.5 | 309,086,076 |
And here’s a table showing the growth of the million-shilling company:
| Number of Days After Start of Business | Capital at Beginning of Stock Period | Profit | Profit Re-Invested in Business | Capital at End of Stock Period |
| 365 | 1,000,000 | 9000000 | 9000000 | 10,000,000 |
| 730 | 10,000,000 | 90000000 | 90000000 | 100,000,000 |
Now, for real-world examples, here is a table showing the average profit margins by industry for 94 industries and the top 10 companies in the world by market capitalization in 2019:
| Industry | Average Profit Margin | Median Inventory Turnover (Times Inventory Replenished in a Year) | Top 10 Companies and Rank in World by Market Capitalization | |
| 1 | Transportation (Railroads) | 50.93 percent | 14 | |
| 2 | Real Estate (General/Diversified) | 41.23 percent | 71 | |
| 3 | Tobacco | 31.42 percent | 1,559 | |
| 4 | Banks (Regional) | 28.99 percent | ||
| 5 | Cable TV | 25.44 percent | ||
| 6 | Investments & Asset Management | 24.52 percent | 25 | |
| 7 | R.E.I.T. | 24.44 percent | ||
| 8 | Beverages (Alcoholic) | 24.35 percent | ||
| 9 | Semiconductor | 21.47 percent | ||
| 10 | Bank (Money Center) | 21.46 percent | ||
| 11 | Financial Svcs. (Non-bank & Insurance) | 20.06 percent | 29/ 67 | |
| 12 | Software (Entertainment) | 18.91 percent | Alphabet Inc. #4, Facebook, Inc. #6, Tencent Holdings Limited #8 | |
| 13 | Telecom. Services | 18.76 percent | ||
| 14 | Real Estate (Development) | 18.42 percent | ||
| 15 | Information Services | 18.41 percent | ||
| 16 | Hotel/Gaming | 17.62 percent | 6 | |
| 17 | Semiconductor Equip | 15.61 percent | ||
| 18 | Utility (Water) | 15.06 percent | ||
| 19 | Telecom (Wireless) | 14.88 percent | ||
| 20 | Brokerage & Investment Banking | 14.23 percent | ||
| 21 | Reinsurance | 13.53 percent | ||
| 22 | Entertainment | 13.43 percent | Alibaba Pictures Group Limited #7 | |
| 23 | Computers/Peripherals | 12.74 percent | Apple Inc. #2 | |
| 24 | Restaurant/Dining | 12.11 percent | ||
| 25 | Food Processing | 11.98 percent | 53 | |
| 26 | Utility (General) | 11.49 percent | ||
| 27 | Retail (Online) | 11.34 percent | Amazon.com, Inc. #3 | |
| 28 | Insurance (Life) | 11.24 percent | ||
| 29 | Drugs (Pharmaceutical) | 10.94 percent | Johnson & Johnson #9 | |
| 30 | Software (System & Application) | 10.45 percent | Microsoft Corporation #1 | |
| 31 | Green & Renewable Energy | 10.02 percent | ||
| 32 | Oil/Gas (Production and Exploration) | 9.94 percent | 19 | |
| 33 | Broadcasting | 9.59 percent | ||
| 34 | Power | 9.57 percent | ||
| 35 | Healthcare Information and Technology | 9.55 percent | Alibaba Health Information Technology Limited #7 | |
| 36 | Insurance (Prop/Cas.) | 9.51 percent | ||
| 37 | Chemical (Basic) | 9.30 percent | 95 | |
| 38 | Oil/Gas (Integrated) | 9.23 percent | Exxon Mobil #10 | |
| 39 | Environmental & Waste Services | 9.19 percent | ||
| 40 | Beverage (Soft) | 8.76 percent | ||
| 41 | Diversified | 8.70 percent | Berkshire Hathaway Inc. #5 | |
| 42 | Shipbuilding & Marine | 8.69 percent | ||
| 43 | Metals & Mining | 8.33 percent | 58/ 57/ 79 | |
| 44 | Electrical Equipment | 8.31 percent | 78 | |
| 45 | Chemical (Specialty) | 8.29 percent | ||
| 46 | Aerospace/Defense | 7.92 percent | ||
| 47 | Air Transport | 7.86 percent | 65 | |
| 48 | Trucking | 7.82 percent | ||
| 49 | Machinery | 7.74 percent | 76 | |
| 50 | Coal & Related Energy | 7.50 percent | 19 | |
| 51 | Construction Supplies | 7.47 percent | ||
| 52 | Steel | 7.32 percent | ||
| 53 | Packaging & Container | 7.30 percent | ||
| 54 | Retail (Building Supply) | 7.29 percent | 96 | |
| 55 | Homebuilding | 7.19 percent | ||
| 56 | Education | 6.81 percent | 10 | |
| 57 | Household Products | 6.79 percent | ||
| 58 | Transportation | 6.74 percent | 4 | |
| 59 | Business & Consumer Services | 6.47 percent | 18 | |
| 60 | Oil/Gas Distribution | 5.98 percent | ||
| 61 | Real Estate (Operations & Services) | 5.87 percent | ||
| 62 | Healthcare Products | 5.80 percent | ||
| 63 | Retail (Distributors) | 5.63 percent | ||
| 64 | Shoe | 5.59 percent | ||
| 65 | Building Materials | 5.23 percent | ||
| 66 | Chemical (Diversified) | 4.97 percent | ||
| 67 | Auto Parts | 4.92 percent | ||
| 68 | Apparel | 4.52 percent | 115/ 98 | |
| 69 | Computer Services | 4.03 percent | ||
| 70 | Retail (Special Lines) | 4.00 percent | ||
| 71 | Retail (Automotive) | 3.90 percent | ||
| 72 | Office Equipment & Services | 3.84 percent | ||
| 73 | Farming/Agriculture | 3.44 percent | 60/ 455 | |
| 74 | Oilfield Svcs/Equip. | 3.25 percent | ||
| 75 | Recreation | 3.25 percent | 34 | |
| 76 | Advertising | 3.10 percent | ||
| 77 | Paper/Forest Products | 3.07 percent | 59 | |
| 78 | Retail (Grocery and Food) | 2.85 percent | ||
| 79 | Rubber & Tires | 2.72 percent | ||
| 80 | Healthcare Support Services | 2.46 percent | ||
| 81 | Electronics (General) | 2.30 percent | 78 | |
| 82 | Furn/Home Furnishings | 2.20 percent | 111 | |
| 83 | Engineering/Construction | 2.18 percent | ||
| 84 | Telecom. Equipment | 2.11 percent | ||
| 85 | Food Wholesalers | 2.05 percent | ||
| 86 | Retail (General) | 1.90 percent | ||
| 87 | Software (Internet) | 1.88 percent | ||
| 88 | Auto & Truck | 1.82 percent | ||
| 89 | Hospitals/Healthcare Facilities | 0.78 percent | ||
| 90 | Publishing & Newspapers | -1.00 percent | 33 | |
| 91 | Drugs (Biotechnology) | -1.61 percent | ||
| 92 | Insurance (General) | -1.61 percent | ||
| 93 | Electronics (Consumer & Office) | -4.07 percent | ||
| 94 | Precious Metals | -5.90 percent |
You’ll notice that none of the top 10 companies in the world feature in the 11 highest profit margin industries.
And a company like Berkshire Hathaway Inc., the 5th top company in the world is within an industry with an average profit margin of 8.70%, which is FIVE times lower than the highest profit margin industry.
You may also note that companies like Alibaba, Amazon, and Apple feature among the top companies, having been started as “small biasharas” in the US and China.


